.png?width=250&height=125&name=TrustBuilderLogoWhiteTranspBackgr(250x125%20px).png "TrustBuilderLogoWhiteTranspBackgr(250x125 px)")

You probably know the old marketing joke that a marketer knows that 50% of his/her marketing is working — they just don't know which 50%. But if you think about it, this is kind of a scary position to be in. Suppose your CEO or marketing director walks through your door right now and asks you:
- How much revenue is influenced by the blog posts we are writing every month?
- How effective are the landing pages we create at generating revenue?
- Which piece of content or interaction is most likely to convert a lead into a customer?
Would you have the answers? Most likely the answer is no. But how valuable would it be to you to be able to answer those questions with a click of a button? If you said "very valuable", you are not alone. In fact, 42% of marketers say that "proving the ROI" of their marketing activities is a crucial priority for this year, according to HubSpot.
Just a few days ago, I had a conversation with a motivated and growth driven marketer who is struggling to prove the value of her inbound marketing efforts to her boss — a traditional sales guy who solely relies on his black book to generate new leads and believes a company's website is just to verify "that they are a real company". But without proper revenue attribution reporting (because numbers don't lie), she doesn't stand a chance.
Well, my friends, starting today the struggle is over. In addition to the new and exciting AI-driven Adaptive Testing and new partitioning features, HubSpot just released a new multi-touch revenue attribution reporting feature for their HubSpot Marketing Hub Enterprise product. Without having to be a data scientist nerd (although they are cool), you can now know exactly what moves the dial — and consequently, better focus your efforts on doing what actually influences revenue.
How To Set Up Revenue Attribution Reporting
As a HubSpot Gold Partner, we got an early sneak peek. I had the opportunity to thoroughly play around with it and, today, I want to take you through the new functionality and tell you how you can set up your own reporting.
(Please note: This functionality is available only for HubSpot Marketing Hub Enterprise customers. If you are interested in upgrading, please contact us for a trial.)
To set up your own revenue attribution report, head over to Reports. In the right-hand top corner, click on "Create custom report", and choose Attribution (bottom). When prompted, choose "revenue" and click next. Once there, you will have two options:
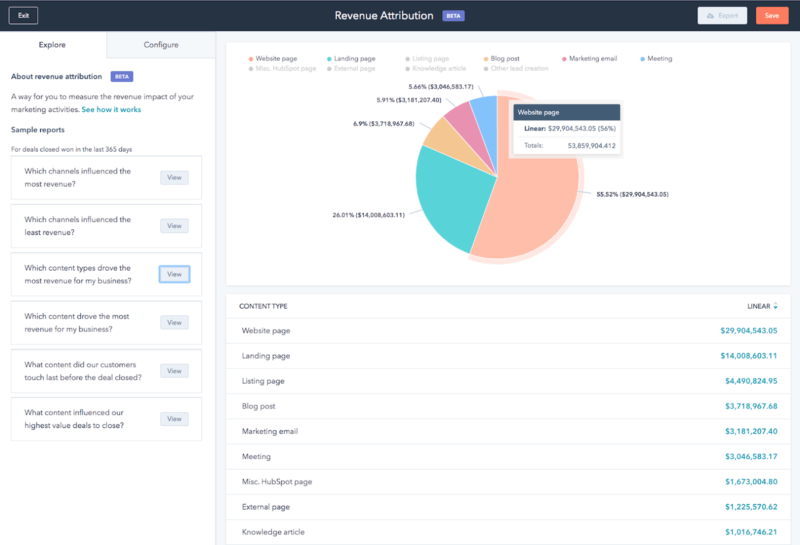
The first tab is "Explore" which contains preloaded reports to answer the following questions without any further configurations:
- Which channels influenced the most revenue?
- Which channels influenced the least revenue?
- Which campaigns influenced the most revenue?
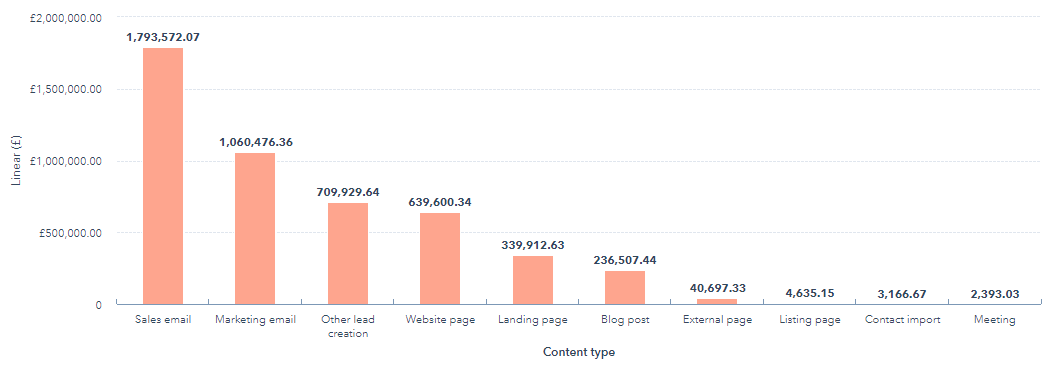
- Which content types drove the most revenue for my business?
- Which content drove the most revenue for my business?
- What content did our customers touch last before the deal closed?
- What content influenced our highest value deals to close?
The second tab is "Configure" which allows you to create your own custom attribution reports or just ad-hoc query the database.
Let's look into the Configure tab a little more.
The left-hand side contains a side bar that is divided into three sections: Style, Filters, and Data. In the Style section, you select the type of visualization you want — whether it is bars, columns, donuts, pie charts, or simple tables.
.png)
In the Filters section, you can choose the date range using the commonly used HubSpot date range filters (e.g., "Rolling date range - 365 days" or "Last Quarter"). You also choose your deal pipeline (if you haven't set up multiple deal pipelines, HubSpot will use your default Sales Pipeline), your deal types (e.g., new business vs. existing customers), and your interactions (Marketing or Sales).
.png)
Last, but not least, you choose which data the attribution reporting will use:
- Content Type, e.g., sales email, website page, and blog post
- Content Title, the name of the content — if not available, the URL will be displayed
- Deal, name of the deal
- Deal pipeline, e.g., sales pipeline
- Deal type, new or existing business
- Campaign, name of the campaign
- Interaction Type, e.g., reply to a sales email, blog post view, or website view
- Interaction Source, e.g., organic, direct, and social media
You can also choose to add another dimension to further slice and dice the data. For example, if you choose "Interaction Source" and "Content Type", you can get detailed insights into which content from what source drives revenue.
Last but not least, you need to choose your revenue attribution model. This is where you decide where to place your emphasis by attributing different weight percentages to different stages. Depending on your business model and your question, you choose different models:
- Linear Attribution. As the name suggests, this attribution model assigns credit to all stages equally which makes a good baseline report to determine which activities in general drive the most revenue (e.g., sales emails vs. marketing emails).
- First-Touch Attribution. If you want to know what attracted people initially to your company or how much revenue your blog generates, the first-touch attribution reports are the right path for you as they place all the emphasis on the interaction that started everything off. Most likely, this will be a high-level awareness-stage marketing offer or page.
- Last-Touch Attribution. If you want to know what actions most influence a lead at the bottom of the funnel before a deal gets closed (e.g., the effectiveness of your landing pages or your sales emails), the last-touch attribution is the way to go. This way, all credit goes to the first touch point of the last interaction, e.g., if a visitor clicks on an email to read a blog post, the email gets all the credit.
- Full Path Attribution. If your business model has long, involved sales cycles (like most B2B tech companies do), the full path attribution is most likely the right attribution model for you as it distributes 90% of the credit (in four equal 22.5% amounts) to the first interaction, the lead creation, the deal creation, and the last interaction while the remaining 10% is distributed equally between all other interactions. This allows you to gain more insight into the pieces of content that drive the most revenue across the entire funnel.
- U-Shaped Attribution. By assigning 40% to the first interaction and another 40% to what led to the conversion, the U-shaped attribution lets you analyze how and where your contacts first interact with your brand. In other words, 80% of the credit goes to the top-half of your funnel. The remainder (20%) is assigned to actions taken after the contact becomes a lead. This is analysis is important for understanding which pieces of content actually generate leads that become customers.
- W-Shaped Attribution. In contrast, the W-shaped attribution model assigns 90% of the credit (in three equal portions of 30%) to the interactions that led to the first interaction, the lead creation, and the deal creation. Because the deal creation is included, this report can help you answer questions regarding your handover efficiency between your marketing and sales team.
Once you have created a report that you like, you can name it appropriately (be sure to use descriptive names like "Revenue Attribution Report By Campaign 2019") and hit save. For easy access and sharing, you can save up to ten different reports to a Revenue Attribution Dashboard.
I hope you find this step-by-step walk through helpful and that it inspires you to give it a try yourself. Please feel free to reach out if you get stuck or if you want me to set up a trial for you because you don't currently have access to HubSpot Marketing Hub Enterprise.
Share this

What Hubspot's Newly Expanded Free Tool Stack Means For Technology Marketers & Salespeople

How To Use HubSpot Lifecycle Stages Correctly
No Comments Yet
Let us know what you think