.png?width=250&height=125&name=TrustBuilderLogoWhiteTranspBackgr(250x125%20px).png "TrustBuilderLogoWhiteTranspBackgr(250x125 px)")

If you have you ever spent seemingly endless hours writing, editing, and revising a single email, you probably have asked yourself if all the effort is really worth it.
I am with you. I still get the jitters. Even after having sent more than a hundred thousand emails in the name of my clients in the past 5 years, I still triple-check everything and hold my breath as I click "Send".
Once the send button is hit, there is no turning back! And then I wonder: How many of these hundreds or even thousands of people I am sending this to will actually take the time to really read it? I give it a few minutes and then check the analytics. How many people opened the email? How many clicked the CTA? And how many will unsubscribe?
This question isn't rhetorical anymore, because now there are answers! With the new HubSpot Email Marketing Dashboard, you can not only see how many people have opened your email, but also dive deeper into who clicked on what link, how many recipients read the email versus only skimmed the text.
Today, I want to walk you through five email marketing statistics you should be tracking every month as part of your inbound marketing program using HubSpot.
(And if you are not yet using HubSpot, contact me, and I will set you up a trial and walk you trough it!)
Email Delivery & Bounced Rate
One of the first performance indicators you should be tracking is your "Email Delivery Rate" and your "Bounced Email Rate." While the Email Delivery Rate tells you how many emails were delivered to your recipient's inboxes, the bounce rate tells you how many did not make it. These are divided up into hard or soft bounces.
HubSpot will register an undelivered email as a hard bounce if the recipient has previously unsubscribed from your emails or the specific email type that was sent to them, marked any previous email from you as spam or cannot be delivered because of a permanent server issue (e.g., email address does not exist). An email is tagged as a soft bounce if it could not be delivered, but the error may be resolved before the next send.
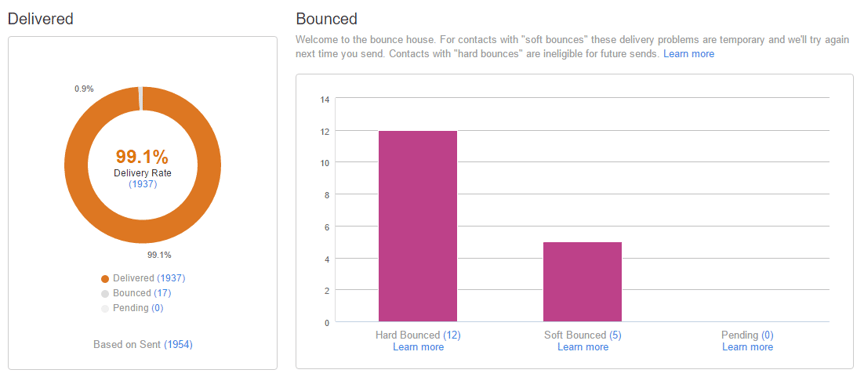
As you can see in the above screenshot, this example shows an email sent to almost 2,000 people. Since we only use inbound marketing to grow this email list, this list is very healthy and engaged.
However, since this client targets companies that often employ consultants in a temporary project capacity, recipients move on to the next project or change jobs — and with that, change their email address. This results in a higher bounce rate, but less than 1% is fantastic considering these circumstances.
Email Open By Device Type & Email Client
In addition to your 'Email Open Rate' that you hopefully track for every email sent, you should keep an eye on your 'Opens By Device Type' and 'Opens By Email Client' once in a while. Depending on how many emails you send and how fast things are changing in your industry, once a month or once a quarter should be sufficient.
Knowing how your audience is accessing and reading your emails will help you determine how to optimize your emails for the email clients and device types your audience uses most.
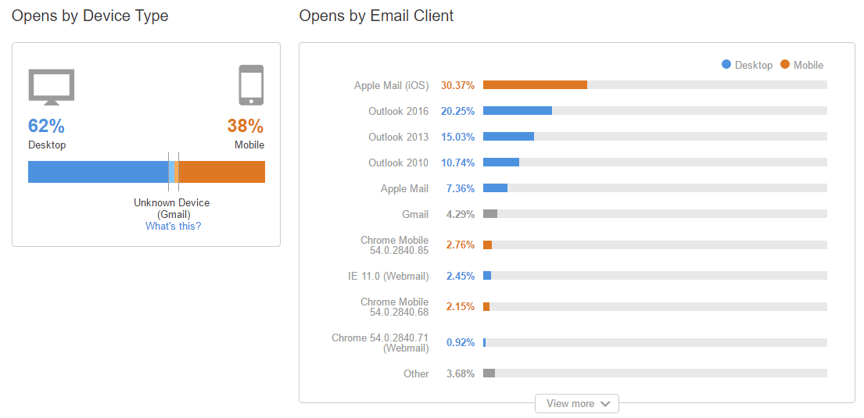
In the example above, we sent an email to a B2B audience that mainly uses Microsoft Outlook as their email client (46%). In addition, 38% of the people were using a mobile device to check their emails.
Your audience might use completely different email clients or prefer their tablet over a desktop. In this case, however, we want to make sure to optimize for and test the email in Outlook 2016, Outlook 2013, Outlook 2010 as well as on an iPhone.
Time Spent Viewing The Email
This is one of my favorite new features of the HubSpot Email Analytics! The dashboard below lets you gauge how your email was received. You can see, that 7% of the recipients only glanced at the email, 67% skimmed through it, and 27% actually read it. Since this wasn't a one-on-one personal email, but a marketing email announcing a new resource that is now available for download, these numbers are very good.
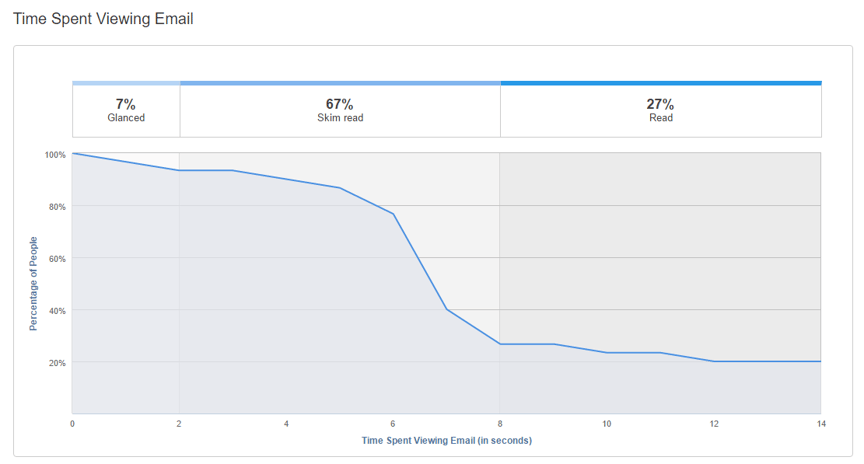
Over time, compare how long-form emails do compared to communication that is kept short and sweet. Ask yourself:
- How does different email types, e.g., newsletters, product announcements, and specific marketing nurture emails compare and how can we improve each?
- Which format does my target persona prefer?
- What else can I do to improve the readability of my emails?
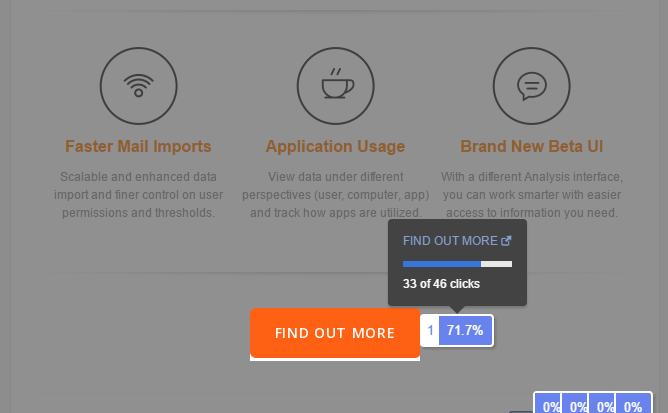
Click Location Map
Another exciting new addition to the HubSpot Email Analytics is the click location map. As you know, emails should contain several opportunities to click on, but it is important to find out which links your readers will click on. For example, do they prefer to click on a button or a link embedded in the text body? Should you place links higher up to improve your click rate? And if you are offering several different types of links, which resource, download, or offer is your audience most interested in?
Email Marketing Performance Over Time
Last, but not least, let's talk about your overall email marketing performance. This relatively new dashboard scores all your emails sent in a specified timeframe (e.g., last month) against your average performance. This way, you can see if you are improving overall in terms of click-through rate and open rate and which emails, in particular, have performed above average.
.png?width=864&height=565&name=Email%20%20%20HubSpot%20(1).png)
Conclusion
You can only improve upon what you measure. If you are already a HubSpot customer, give the new HubSpot Email Analytics a spin and make time every month to learn more about your efforts. While email marketing has one of the best return-on-investments of all inbound marketing tactics, it is up to you to make sure you are spending your time wisely and optimize your communication to your buyer persona's needs and wants.
If you have not tried out HubSpot yet, give it a try. Click below, and we will set up a 30-day trial for you. For free, no-strings-attached. We even walk you through the software and tell you how to get the most out of your trial.

Share this

58 Inbound Marketing Ideas That You Should Be Doing, But Aren't (Yet)

How To Get 5x More Meetings Booked By Using Video Email In Your Inbound Sales Process

No Comments Yet
Let us know what you think